Ramia Ahmed

Data & Insights Analyst
About Me
I’m a Data & Insights Analyst based in Dhaka, Bangladesh, focused on B2C e-commerce — turning raw transaction, clickstream, and marketing data into decisions a stakeholder can actually act on. Each project below follows the same structure: Background, Data, Executive Summary, Deep-Dive Insights, and Recommendations — built with SQL (DuckDB), Excel, and Power BI.
Tools:





Featured Projects
1. Customer Segmentation & Spend Analysis
Olist Brazilian E-Commerce dataset — ~96,000 orders, ~93,000 customers
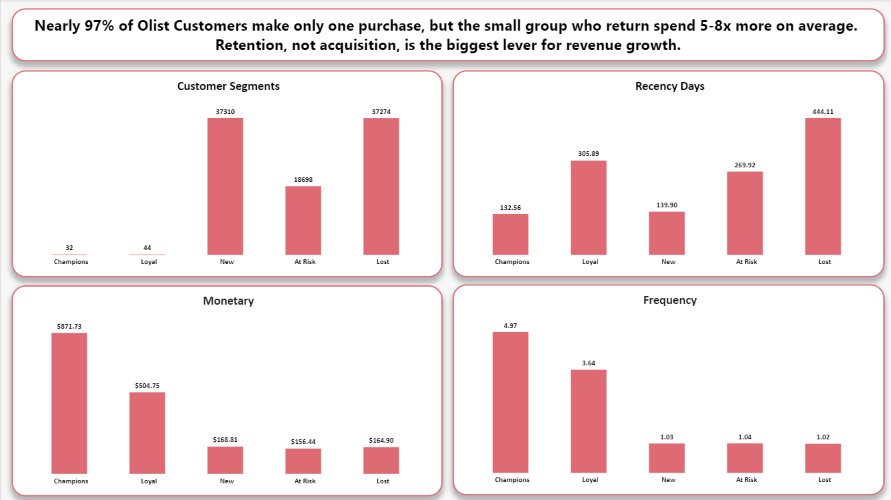
RFM segmentation combined with AOV, GMV, retention, and CSAT analysis in one connected story. Found that only 3% of customers ever place a second order, and that satisfaction (4.09/5 average) collapses sharply — not gradually — the moment a delivery runs late.
2. Cart Abandonment Funnel Analysis
Retail Rocket clickstream dataset — 2.7M+ raw events
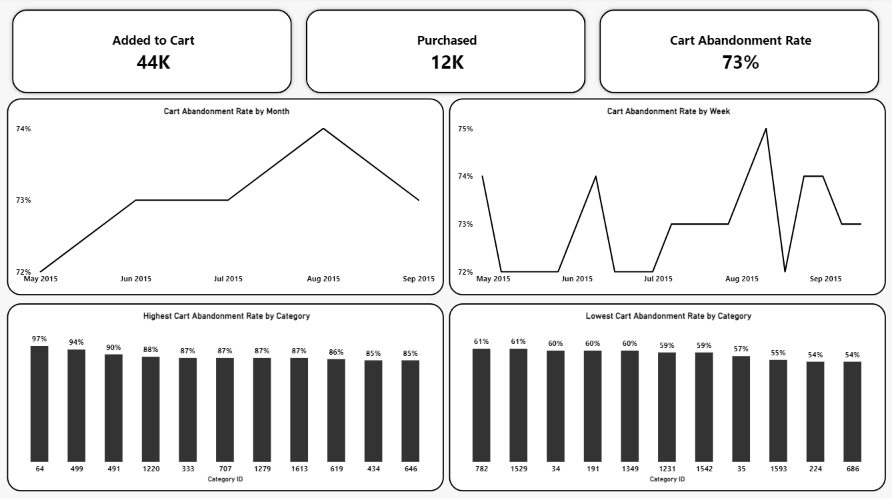
Built session and funnel logic from scratch on raw event data to measure cart abandonment. Overall rate (72.8%) is in line with industry norms and flat over time — but abandonment by product category ranges from 47% to 97%, the strongest lever in the data.
3. CAC & LTV Ratio Analysis
Synthetic marketing dataset — 6 channels, 12-month window
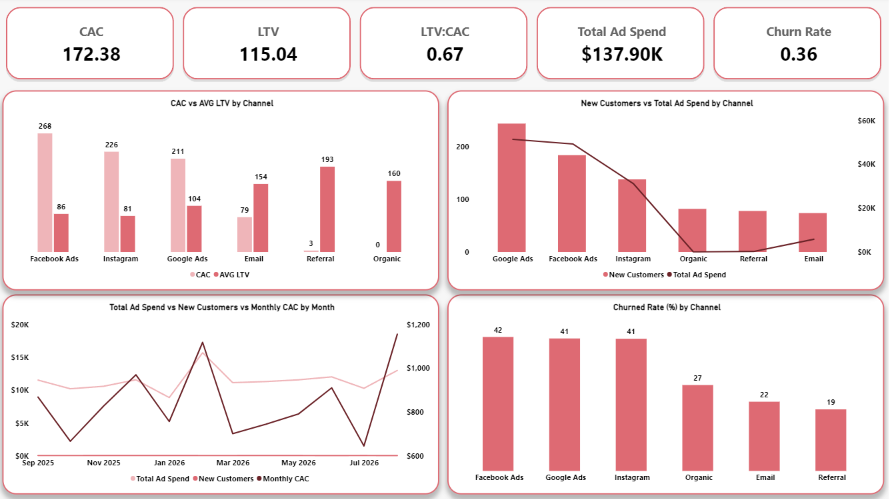
Compared acquisition cost against customer lifetime value by channel. Blended LTV:CAC sits at 0.67 — the business spends more acquiring customers than they’re worth on average — driven almost entirely by paid channels acquiring at a loss while churning customers twice as fast as organic/email/referral.
4. RFM Segmentation & Cohort Retention Analysis
UCI “Online Retail” dataset — ~540,000 invoice line items
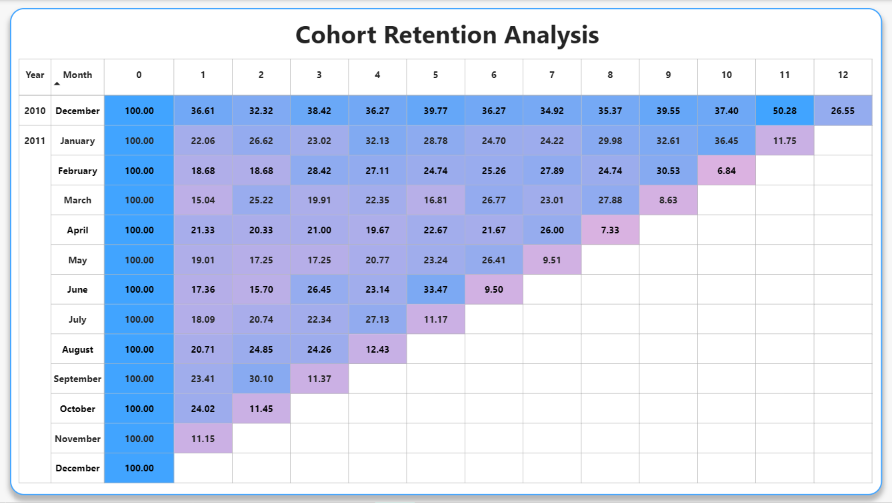
Paired RFM segmentation with month-over-month cohort retention. 265 “Champion” customers generate $5.7M — more than every other segment combined — and retention drops off a cliff after month 1 but stabilizes into a distinct “core repeat” base afterward.
5. Conversion Rate Analysis
UCI “Online Shoppers Purchasing Intention” dataset — 12,330 sessions
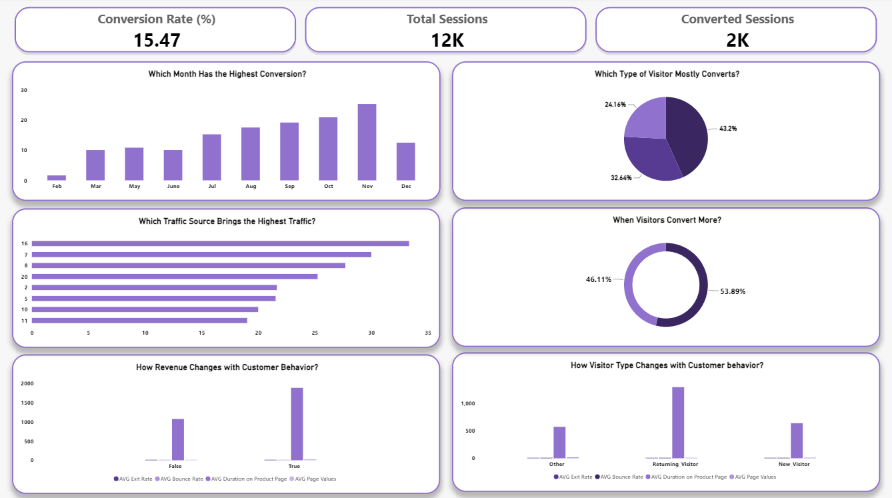
Analyzed which visitor types, timing, and on-site behaviors predict purchase. Overall conversion is 15.47%, more than doubling from a February low to a November peak — and on-site engagement (page values, exit rate) separates converters from non-converters far more sharply than any demographic split.
6. ROAS & ROI Analysis
Synthetic marketing dataset — 6 channels, 15 campaigns
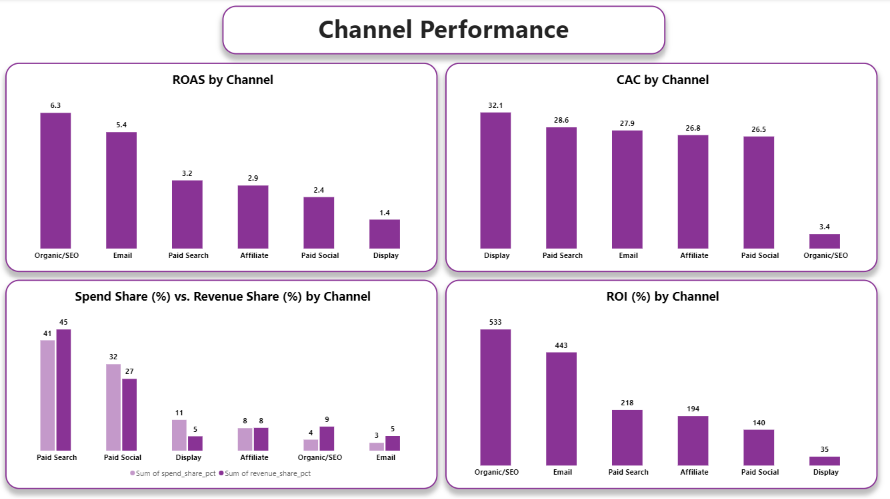
Evaluated marketing return across channels and campaigns. Overall spend is profitable (2.89 ROAS, 189% ROI), but channel performance varies more than 4x — and the gap comes down to acquisition cost, not funnel quality, since click-through and conversion rates are nearly identical across every channel.
7. Refund Rate Analysis
Synthetic retail dataset — 15,000 orders, 2,159 returns
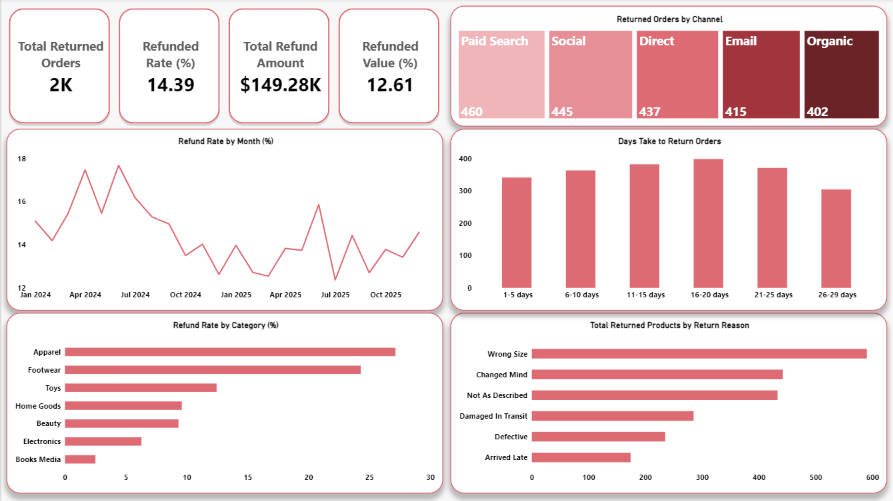
Investigated what drives product returns for a mid-sized retailer. Overall refund rate is 14.39% by order count, but category tells the whole story: refund rate ranges from 27% (apparel) down to 2.5% (books & media) — an 11x spread — while channel and time period show almost no variation.
Currently Learning
A/B Testing for analytics
Let’s Connect
LinkedIn · GitHub · Open to remote Data & Insights Analyst opportunities